1. How to read the graph
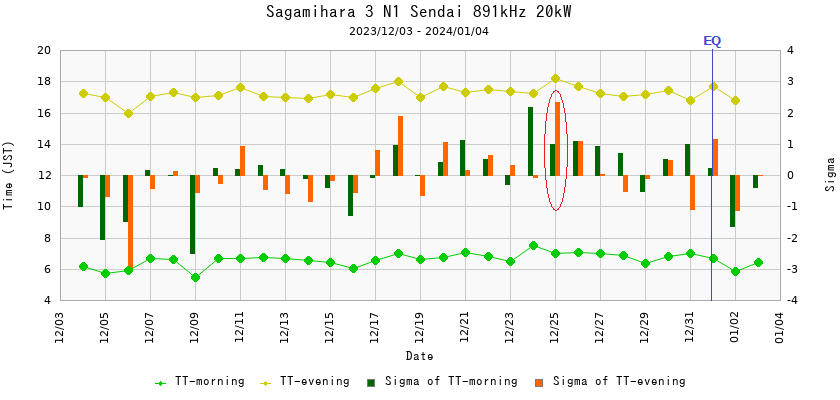
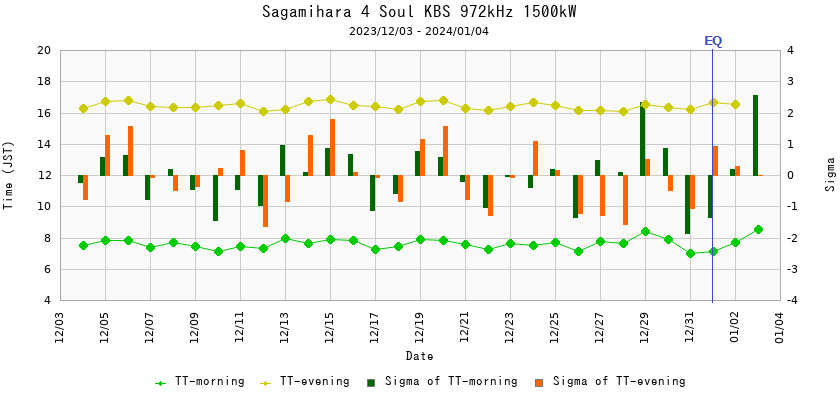
-Green line graph: Morning Terminator Time (JST, left scale, hereinafter referred to as TT)
-Yellow line graph: Evening Terminator Time (JST, left scale)
-Green bar graph: Standard deviation of morning TT (σ Sigma, right scale)
-Orenge bar graph: Standard deviation of evening TT (σ Sigma, right scale)
-EQ: Occured Time of Noto Peninsula Earthquake (2024/1/1 16 : 10)
2. Transmitting broadcast station
The analysis data is created by hand, so it is limited to the following 6 stations
-Kushiro : NHK-1 585kHz 10kW
-Sapporo : NHK-1 567kHz 100kW
-Sendai : NHK-1 891kHz 20kW
-Matsue : NHK-1 1296kHz 10kW
-Soul : KBS Soul Radio 972kHz 1500kW
-Pusan : KBS Pusan Radio 891kHz 250kW
3. Receiving point
-Near Hashimoto Station, Midori Ward, Sagamihara City, Kanagawa Prefecture
4. Anomary Condition
-The evening TT on December 25th was synchronized from Kushiro, Sapporo, Sendai, Matsue to Sagamihara Path,
and σ exceeded +2.
-The morning TT on December 25th is synchronized from Kushiro, Sapporo, Sendai, Matsue to Sagamihara Path,
and σ is approximately +2.
-Exceeding σ=2 after January 1 is considered a sign of aftershocks.
-There is no synchronization in the data from Soul(Seoul) and Pusan(Busan),
so it cannot be said that an ionospheric anomaly has occurred.
5. Anomaly Data
- Kushiro Hokkaido

- Sapporo Hokkaido

- Sendai Miyagi Pref.
- Matsu Shimane Pref.

- Soul Korea
- Pusan Korea
