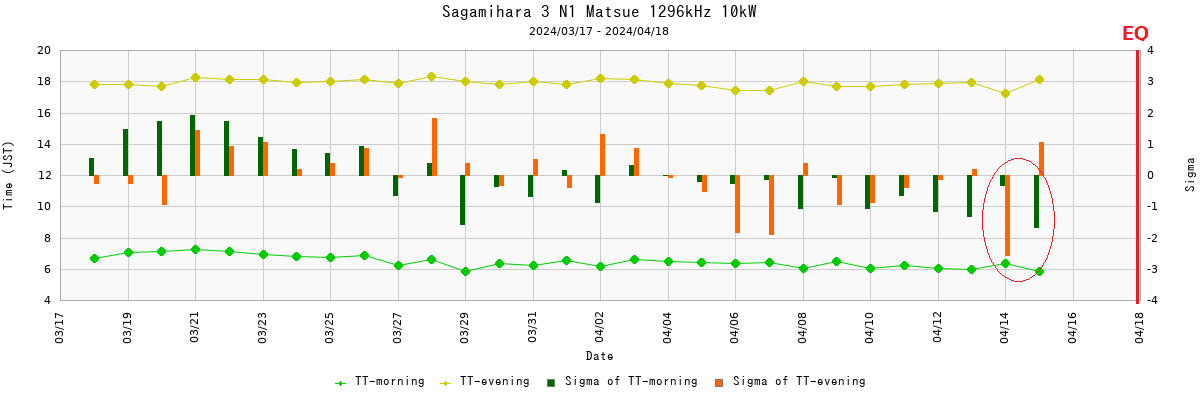
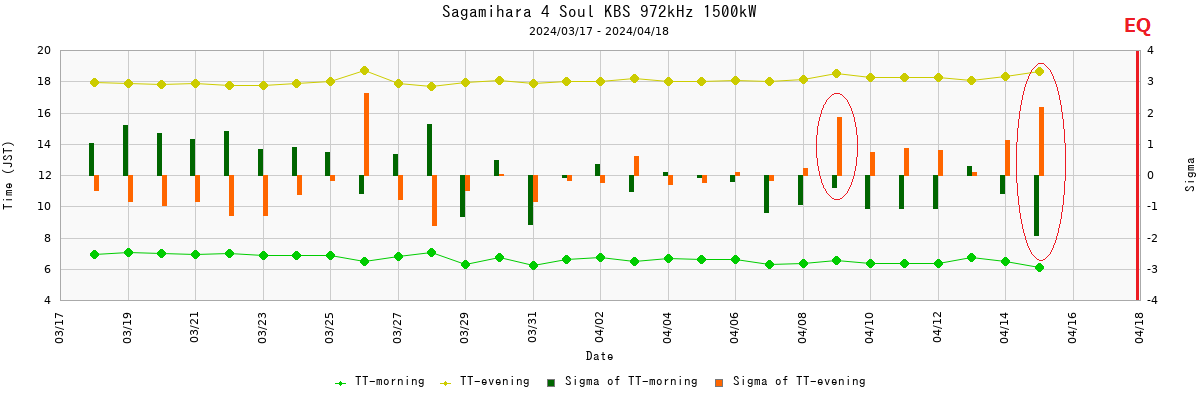
1. How to read the graph
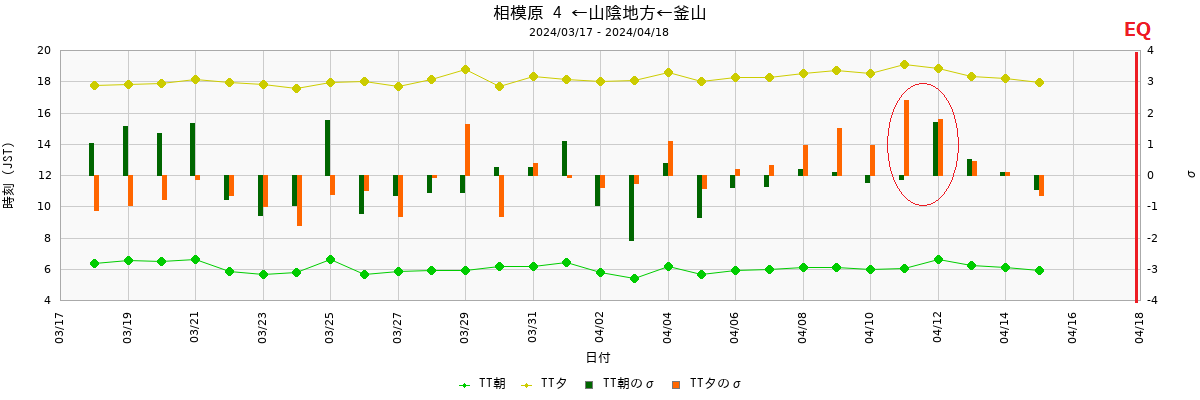
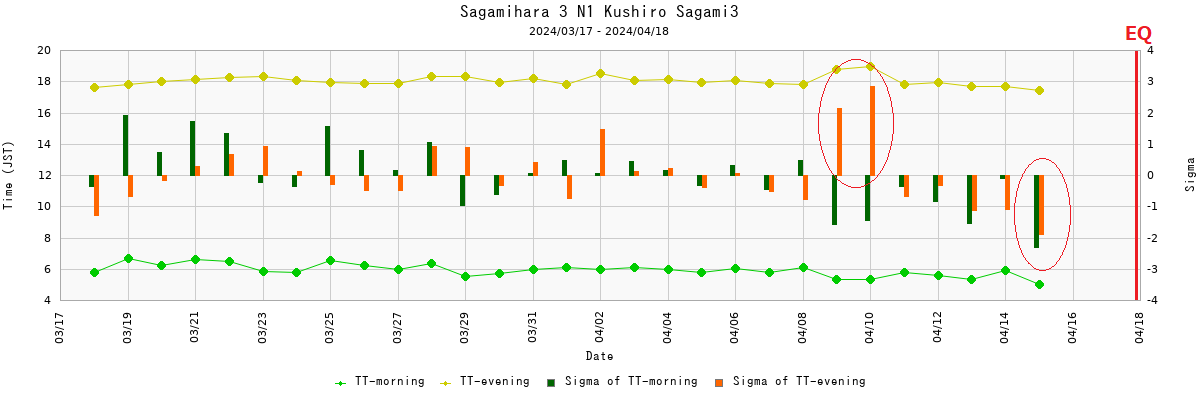
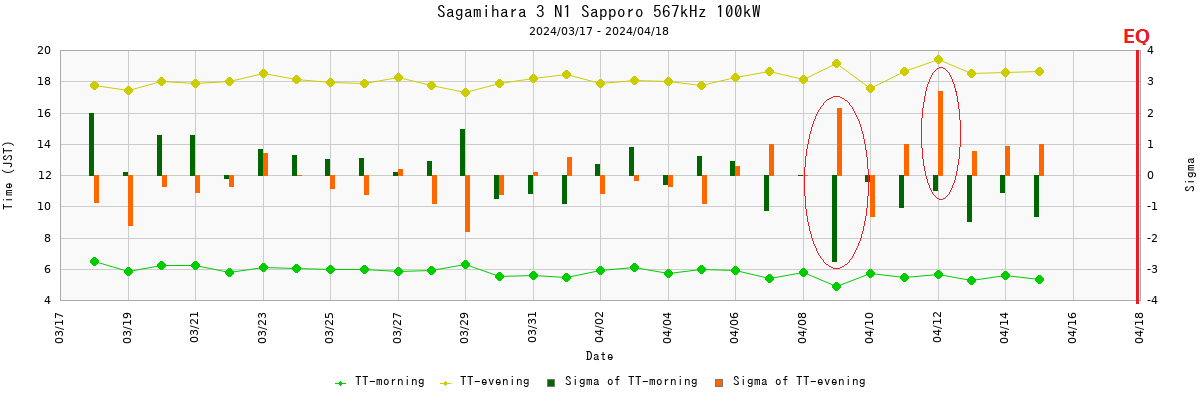
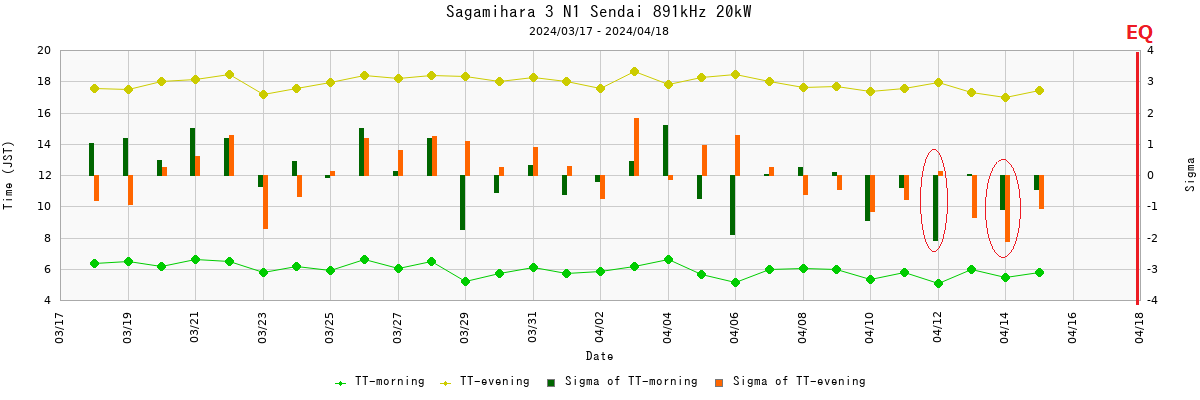
-Green line graph: Morning Terminator Time (JST, left scale, hereinafter referred to as TT)
-Yellow line graph: Evening Terminator Time (JST, left scale)
-Green bar graph: Standard deviation of morning TT (σ Sigma, right scale)
-Orenge bar graph: Standard deviation of evening TT (σ Sigma, right scale)
-EQ: Occured Time of Noto Peninsula Earthquake (2024/1/1 16 : 10)
2. Transmitting broadcast station
The analysis data is created by hand, so it is limited to the following 6 stations
-Kushiro : NHK-1 585kHz 10kW
-Sapporo : NHK-1 567kHz 100kW
-Sendai : NHK-1 891kHz 20kW
-Matsue : NHK-1 1296kHz 10kW
-Soul : KBS Soul Radio 972kHz 1500kW
-Pusan : KBS Pusan Radio 891kHz 250kW
3. Receiving point
-Near Hashimoto Station, Midori Ward, Sagamihara City, Kanagawa Prefecture
4. Anomary Condition
-4/9 evening TT synchronized with Kushiro, Sapporo, Seoul to Sagamihara path, σ exceeds +2
-4/12 evening TT synchronized with Sapporo, Busan to Sagamihara path, σ exceeds almost +2
-4/14 evening TT synchronized with Sendai, Matsue to Sagamihara path, σ exceeds almost +2
-4/15 morning TT synchronized with Matsue, Seoul to Sagamihara path, σ exceeds almost +2
- Kushiro Hokkaido
-Sapporo Hokkaido
- Sendai Miyagi
- Matsue Shimane
- Seoul Korea
- Busan Korea